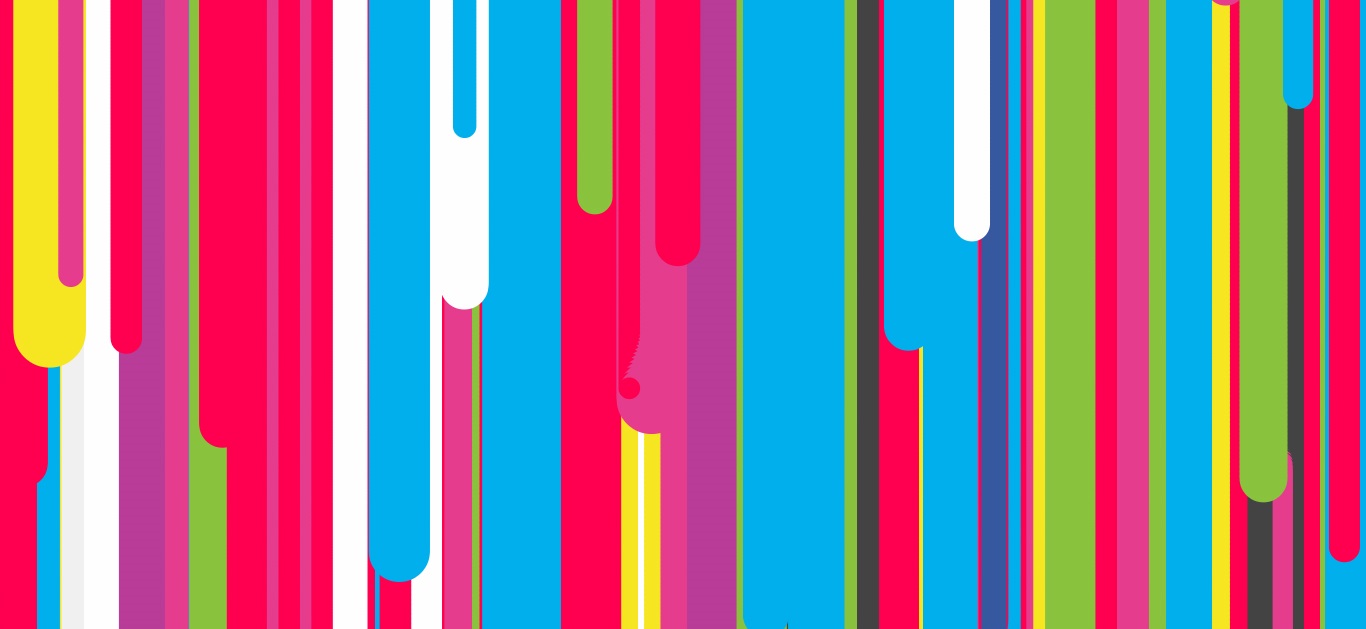
This is a data visualization project that listens to tweets in real-time and renders a colored block on the screen representing the color mentioned in the tweet.
Technology: It is a node.js web application that streams data using Twitter APIs. On the client-side it uses HTML canvas to render paint drips as per the following.
var redcount = 8;
var yellowcount = 4;
var greencount = 8;
var bluecount = 8;
var purplecount = 8;
var orangecount = 4;
var pinkcount = 8;
var greycount = 6;
var tealcount = 1;
var whitecount = 8;
Inspiration: Jackson Pollock's drip paintings.
Note: Please refresh the website if it doesn't load properly the first time.
